Los Angeles Crime Risk Analysis for Tourists
Los Angeles Crime Risk Analysis for Tourists —Identifying Safer and Higher-Risk Tourist Areas Using Crime Data
In collaboration with: Hadassah Hajabakiga, Poongping Suthumpun, Wenbingbing Luo, Yuejia Yang.
This project analyzes crime patterns across Los Angeles to identify which tourist locations experience higher crime activity and which areas are safer for visitors.
Using recent crime data from Los Angeles (2022–2023), the analysis explores temporal patterns, geographic hotspots, and crime type distributions to provide insights that can help tourists make safer travel decisions and assist city planners in improving public safety.
Business Problem
Los Angeles attracts millions of visitors every year. However, safety concerns often influence tourists' travel decisions.
Tourists frequently ask:
-
Which tourist areas are safest to visit?
-
When is crime most likely to occur?
-
What types of crimes are most common?
Understanding crime patterns can help travelers plan safer trips and help city officials allocate security resources more effectively.
This project aims to identify high-risk tourist locations and safer alternatives using crime data analytics.
Dataset Overview
The dataset includes crime reports from the City of Los Angeles Crime Data (2020–Present).
The analysis focuses primarily on data from 2022–2023.
Key variables include:
-
crime type
-
location coordinates
-
date and time of occurrence
-
neighborhood or district
-
victim information
This data allows for analysis of both temporal crime patterns and geographic crime hotspots.
Exploratory Data Analysis
To understand crime patterns, several exploratory analyses were performed:
-
hourly crime trends
-
day-of-week patterns
-
geographic crime distribution
-
crime type frequency
These analyses help reveal when and where crime is most likely to occur.
Temporal Crime Patterns
Analysis of crime occurrences by time reveals several key patterns.
• The highest crime activity occurs around Friday at noon.
• The lowest crime activity occurs between 2 AM and 5 AM.
• Peak crime levels tend to occur more often on weekdays than weekends.
These patterns highlight the importance of time when evaluating tourist safety.
Geographic Crime Hotspots
Mapping crime locations across Los Angeles reveals clear spatial clustering.
The highest crime concentrations are located in the downtown corridor and surrounding commercial and residential areas.
Crime hotspots also expand outward during summer months, possibly due to increased tourism and seasonal activity.
Tourist Locations vs Crime Risk
To make the analysis more useful for travelers, we compared popular tourist attractions with nearby crime levels.
This allowed us to identify high-crime tourist locations and safer destinations.
High-Crime Tourist Attractions
Some popular tourist areas experience relatively high levels of nearby crime activity.
Examples include:
-
Dodger Stadium
-
Grand Central Market
-
Crypto.com Arena (LA Live)
-
Hollywood Walk of Fame
-
Exposition Park (USC area)
These locations attract large crowds, which may increase opportunities for theft and other crimes.
Safer Tourist Attractions
Several popular attractions show relatively lower surrounding crime levels.
Examples include:
-
Santa Monica Pier
-
Griffith Observatory
-
Beverly Hills / Rodeo Drive
-
Universal Studios Hollywood
-
The Getty Center
These locations tend to have stronger security presence or different urban environments.
Crime Type Analysis
The analysis also examined the most common crime types in Los Angeles.
The top crimes include:
-
Vehicle-related crimes — 11.4%
-
Battery — 10.1%
-
Burglary — 9.9%
-
Identity theft — 9.9%
-
Vandalism — 9.7%
-
Theft from vehicles — 8.5%
-
Assault with a deadly weapon — 8.5%
For tourists, the three most relevant crime categories are:
• vehicle-related crimes
• theft
• burglary
These crimes frequently target visitors who are unfamiliar with the area.
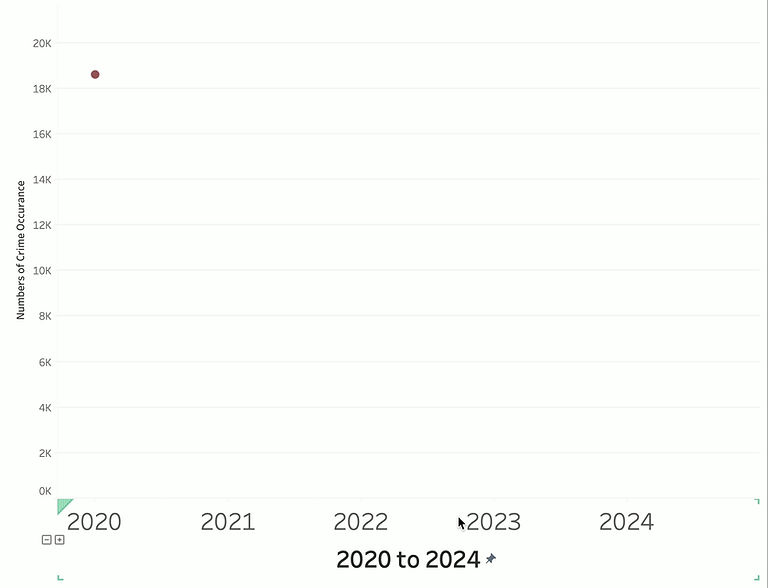
Crime Trend Analysis
Crime levels show changes over time, influenced by factors such as:
-
post-pandemic recovery
-
economic conditions
-
law enforcement initiatives
Recent data suggests that crime levels have declined from approximately 600 incidents to 349 incidents in certain monitored periods, indicating potential improvements in safety conditions.
Key Insights
Several important insights emerged from the analysis:
Crime hotspots are concentrated in central urban areas, particularly downtown corridors.
Crime peaks during midday and weekday periods, when city activity is highest.
Crowded tourist attractions may experience higher theft-related crime rates.
However, many major tourist destinations remain relatively safe due to security presence and infrastructure.
Recommendations
Based on the analysis, several safety recommendations can be made for tourists and city planners.
Improve Parking Security
Since vehicle-related crimes are the most common, improved parking surveillance and lighting can help reduce theft.
Visitor Awareness
Tourists should be provided with clear safety guidance regarding:
-
safe parking areas
-
high-risk time periods
-
common theft scenarios
Resource Allocation
City authorities may consider deploying additional security resources during peak crime periods and around crowded tourist attractions.
These strategies can improve safety while maintaining accessibility for visitors.
Tools & Methods
-
Data cleaning and preprocessing
-
Exploratory data analysis (EDA)
-
Spatial data visualization
-
Heatmap analysis
-
Crime type distribution analysis
Skills Demonstrated
-
Data analysis
-
Geographic data visualization
-
Time-series pattern analysis
-
Crime risk analytics
-
Data storytelling
Project Impact
This project demonstrates how public crime data can be used to generate insights that help travelers make safer decisions and support data-driven urban safety planning.
By combining temporal, spatial, and categorical crime analysis, the project highlights how data analytics can improve public awareness and city safety strategies.