
SafeSight Analytics –
Industrial Safety Intelligence Dashboard
🏆 1st Place Winner —
Google Cloud × Methanex Hackathon (14 Teams)
In collaboration with: Christy Hoang, Doreen Zhu, Lena Enkhbayar, Monica Li
This project was developed during the Google Cloud × Methanex × UBC Sauder Hackathon, where our team designed an AI-powered safety analytics system to identify patterns in industrial incident reports and predict high-severity risks.
Severity Scoring Framework
To quantify the impact of incidents, we developed a weighted severity scoring system.
Rather than relying solely on categorical labels, each incident received a composite severity score calculated from multiple attributes.
Factors contributing to the severity score included:
• incident category
• risk level
• injury classification
• number of corrective actions
• contextual operational variables
Each factor was assigned a weight representing its contribution to operational risk, producing a continuous severity scale.
This allowed incidents to be ranked by overall safety impact.
Integrating Severity Scores with Clustering
After computing severity scores, we integrated them with the cluster analysis.
This allowed us to identify:
• clusters associated with the highest severity incidents
• operational conditions linked to elevated risk
• priority areas for safety intervention
For example, clusters related to maintenance operations and pressure isolation failures showed significantly higher severity scores.
Combining clustering with severity scoring enabled both:
Pattern discovery (unsupervised learning) and Risk quantification (scoring framework).
Cluster Frequency Analysis
We further analyzed incident frequency across clusters to identify the most common risk scenarios.
This analysis revealed which operational hazards appear most frequently in the dataset.
Interactive Safety Dashboard
To support safety teams in monitoring incident trends, we built an interactive dashboard in Looker Studio.
The dashboard enables users to explore:
• severity distribution
• incident trends over time
• safety risk heatmaps by site
• operational activity categories
This centralized view allows decision-makers to identify emerging safety risks across locations.
Machine Learning Severity Prediction
To move beyond descriptive analysis, we built a machine learning model to predict incident severity.
Model approach:
Text feature extraction
• Combined incident narratives (What Happened, Root Causes, Causal Factors)
Feature engineering
• TF-IDF vectorization of key keywords
Predictive model
• Random Forest classifier
Feature importance analysis was conducted using:
• SHAP values
• permutation importance
These techniques helped identify the most influential predictors of high-severity incidents.
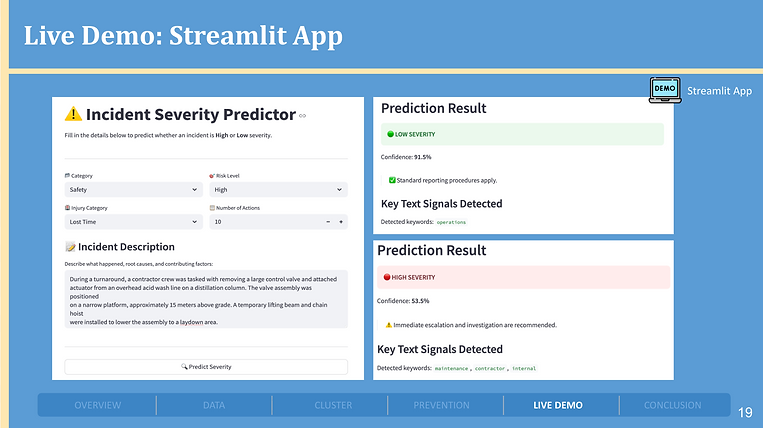
AI-Powered Incident Response Platform
To translate our analytics insights into a practical operational tool, we developed a prototype AI-powered incident response website using Claude.
The system allows safety teams to quickly evaluate new incidents and receive immediate recommendations for response and prevention.
How the Tool Works
The workflow is designed to support rapid decision-making during incident reporting:
-
A user uploads an image or description of a safety incident.
-
The system analyzes the incident narrative using natural language processing.
-
The model identifies the most similar historical incident patterns using the previously discovered risk clusters.
-
Based on the analysis, the system generates three levels of guidance:
• Immediate actions to stabilize the situation
• Short-term corrective actions to prevent recurrence
• Long-term recommendations for operational improvements
This allows safety teams to move from reactive incident reporting to proactive safety management.
Recommendations & Business Impact
Based on the incident clustering, severity analysis, and predictive modeling results, we developed a set of recommendations to help Methanex improve its safety management processes.
Our recommendations focus on both operational safety practices and long-term data infrastructure improvements.
Operational Safety Improvements
The cluster analysis revealed recurring operational risks, particularly related to pressure isolation procedures, maintenance activities, and communication gaps.
To reduce these risks, we recommended the following actions:
Improve isolation verification procedures
• Implement digital isolation checklists
• Require supervisor verification before high-risk operations
Enhance operational communication
• Standardize shift handover checklists
• Reinforce communication protocols between teams
Reduce time pressure in high-risk tasks
• Introduce buffer time for safety-critical operations
• Improve staffing and scheduling during maintenance activities
Upgrade safety infrastructure
• Add pressure relief safeguards
• Upgrade small hydraulic systems that increase failure risk
These measures target the root causes identified in the clustering analysis, enabling safer operational procedures.
Digital Safety Reporting System
Another major limitation identified in the analysis was the current incident reporting process, which relies heavily on unstructured PDF reports.
This format makes it difficult to analyze incident trends across time and locations.
To address this, we proposed transitioning to a digital incident reporting system.
Key improvements include:
• replacing free-text reports with structured digital forms
• standardizing key safety variables for analysis
• reducing manual data entry errors
• enabling real-time querying and analytics
This transformation would allow organizations to move from reactive incident documentation to proactive safety intelligence.
Strategic Impact
By implementing these recommendations, organizations can significantly improve their safety management capabilities.
Key benefits include:
• earlier detection of high-risk operational scenarios
• faster incident response through AI-assisted analysis
• improved cross-site knowledge sharing
• data-driven safety decision making
Together with the AI-powered incident response platform and predictive severity model, these recommendations provide a scalable framework for modernizing industrial safety management.


Business Problem
Industrial safety incidents are typically reviewed case-by-case, making it difficult for organizations to identify recurring patterns across locations and time periods.
This creates several major challenges:
• Safety incidents are reviewed individually rather than systematically
• Data silos prevent cross-site learning
• Organizations lack predictive insight into high-severity risks
• Critical safety patterns remain hidden in large volumes of incident reports
As a result, safety teams operate in a reactive process, responding only after incidents occur rather than proactively identifying risk.
Dataset
The analysis was conducted using historical industrial safety reports from multiple operational sites.
Dataset characteristics:
• 196 safety incidents analyzed
• 2019 – 2024 time period
• 600+ pages of incident reports
• 20+ structured variables extracted from reports
Each report contained narrative descriptions of incidents, root causes, and operational conditions.
These reports were originally stored as unstructured PDF documents, making them difficult to analyze at scale.
Data Pipeline
To analyze these reports, we built a complete data processing pipeline that converts raw incident reports into structured analytics data.
Pipeline workflow:
-
Raw safety reports collected as PDF documents
-
AI-assisted parsing to extract structured features
-
NLP preprocessing (tokenization, stop-word removal, normalization)
-
Structured dataset uploaded to Google BigQuery
-
Interactive dashboards created in Looker Studio
This pipeline enabled the transformation of large volumes of narrative incident reports into structured analytics datasets.
Pattern Discovery (NLP Clustering)
To uncover hidden safety patterns, we applied unsupervised clustering on incident narratives using NLP feature representations.
The clustering analysis revealed five recurring operational risk patterns, including:
Pressure Isolation Failure
Operational errors involving valves, hydraulic systems, and isolation procedures.
AI Governance & Validation
Risks associated with automation systems and insufficient validation.
HR Data & Document Security
Incidents involving sensitive information and communication channels.
Cyber Control & Maintenance
Maintenance operations and remote system access vulnerabilities.
Contractor Access & Worksite Safety
Worksite hazards involving contractors, signage, and electrical risks.
These clusters reveal underlying safety patterns hidden within incident reports.
3D Cluster Visualization
To validate cluster separation, incident reports were projected into a 3-dimensional embedding space.
Each point represents an individual incident case, positioned based on its textual similarity to other reports.
Clear spatial separation between clusters demonstrates that the NLP model successfully captured distinct categories of operational risk.